Clear Skies Ahead: Breaking Through The Gross-to-Net Fog
Gain unprecedented visibility in Gross-to-Net
In the complex life sciences landscape of financial and commercial operations, gaining clear visibility into your Gross-to-Net (GtN) process is no longer a “nice-to-have” – it's fundamental to making strategic business decisions.
Having worked with numerous life sciences companies in this space, I understand how challenging it can be to extract meaningful information from GtN data quickly and with the level of detail needed for effective decision-making. That's why I'd like to share additional key dimensions crucial for transforming data into useful insights. I'll walk you through practical approaches that will provide you with a clear understanding of how to navigate the complexities of GtN and help you make informed decisions that can impact your business strategy.
Avoid the mist: the importance of the “HOW” and the “WHY”
Traditionally, the Gross-to-Net waterfall has focused on how incentives are distributed, whether through on-invoice like special prices or discounts or off-invoice like rebates or chargebacks. The structure I use takes a unique approach by probing deeper into the why behind these incentives, introducing a new dimension to the process.
When your company underestimates the importance of capturing critical information in the GtN process, it's like navigating through dense fog without proper instruments. You risk making poorly informed decisions that can significantly impact profitability and strategic direction when you can't see what's ahead. Understanding the how and why behind each adjustment acts like a sophisticated radar system, cutting through the fog to provide clear visibility, leading to better strategic planning and greater operational efficiency.
Clearing the horizon: mapping your GtN control zones
When examining the why, you can streamline your approach by distinguishing between what is within your company's control – driven by commercial rationale – and what is imposed by mandatory conditions, such as obligatory discounts or clawbacks from health authorities. You can explore deeper nuances, identifying whether an incentive is commercial – such as promotions aimed at specific products or families in the market (excluding those for market access customers) or related to trade activation, where price reductions, discounts, or bundled offers are passed on to the end customer, as seen in Patient Support Programs (PSPs).
It’s essential to recognize that some incentives, like outcome-based agreements (OBAs), can serve as government-mandated rebates and commercial incentives. For instance, OBA agreements negotiated with public hospitals are categorized as government-mandated rebates. In contrast, those negotiated with private hospitals are considered commercial incentives as the company decides to offer them. This distinction underscores the importance of capturing the underlying reasons behind these agreements rather than merely categorizing them by contract type, incentive or discount.
Achieving this level of detail enriches your GtN analysis through a multi-dimensional lens, considering factors such as customer, product, brand, region, division and therapeutic indication. However, it also requires you to clearly define each incentive’s rationale (the why) at the contract level. You must find a balance between the effort needed to articulate the granularity of the why and the necessity for broader, less detailed categories.
Imagine a simple cylinder casting shadows that appear as a circle or a square, depending on the viewing angle. Both perspectives are valid, yet viewed individually, neither provides a complete understanding of the object.
This analogy illustrates the multi-dimension view needed to gain full visibility into your Gross-to-Net:
- HOW: These are the methods of providing incentives or expenditures, such as special pricing, discounts, rebates and outcome-based measures.
- WHY: This dimension encapsulates the rationale behind these incentives or expenditures, including mandatory conditions, market access needs and commercial strategies.
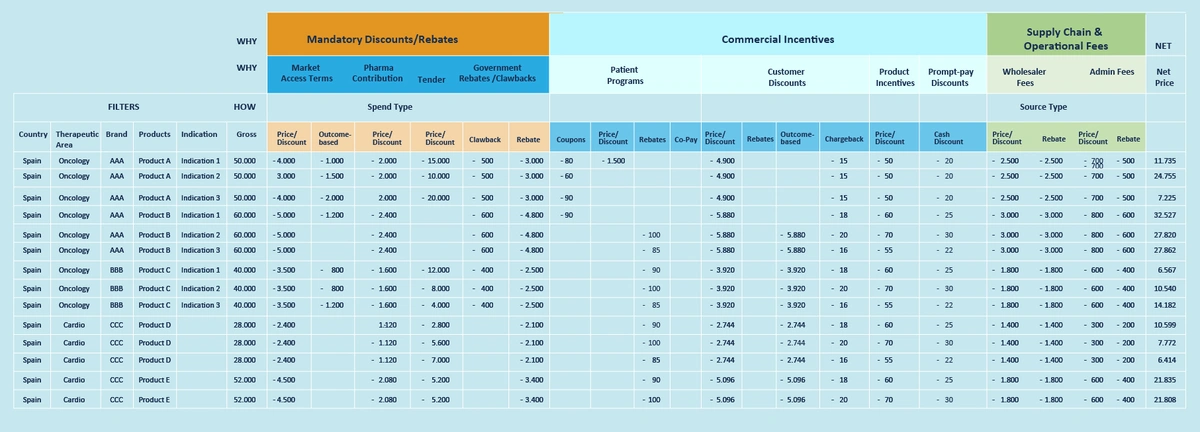
This balanced perspective enables you to capture the entirety of your operations without complicating your accounting structures. Below is a simplified proposal for illustrative purposes (note: returns and royalties have been excluded for clarity).
My proposed structure introduces a more streamlined approach to the why dimension by simplifying the L1 and L2 levels. This significantly reduces the workload associated with maintaining L2 and additional L3 attributes within contracts. Additionally, the how dimension will be efficiently derived from the type of contract, enhancing your reporting process without increasing the workload for contract administrators.
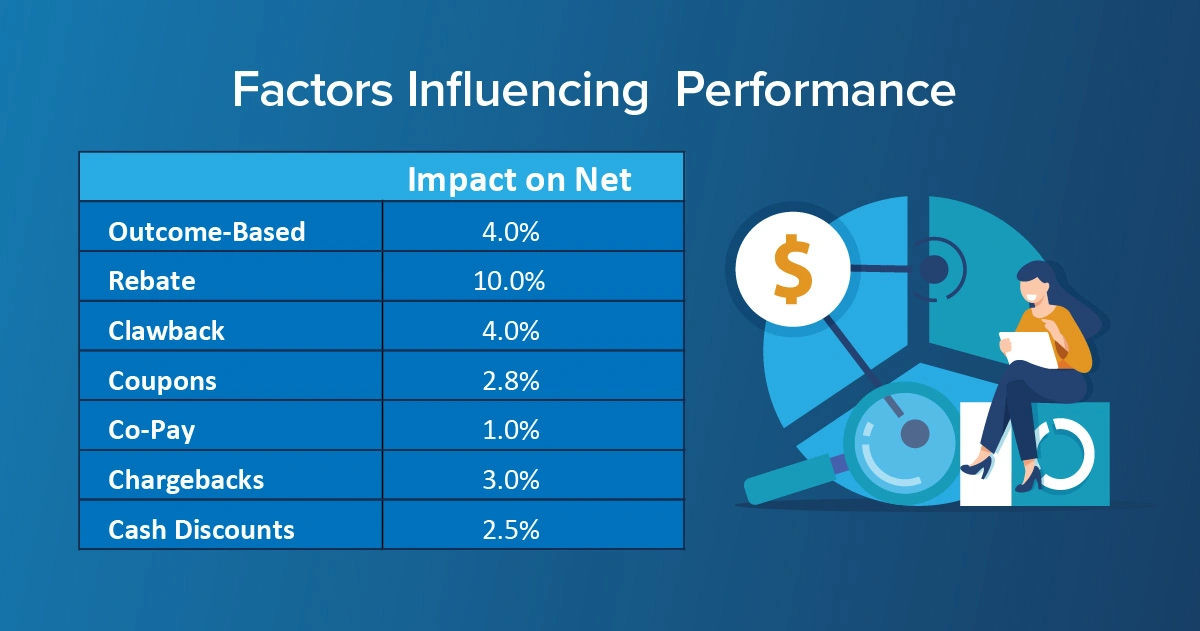
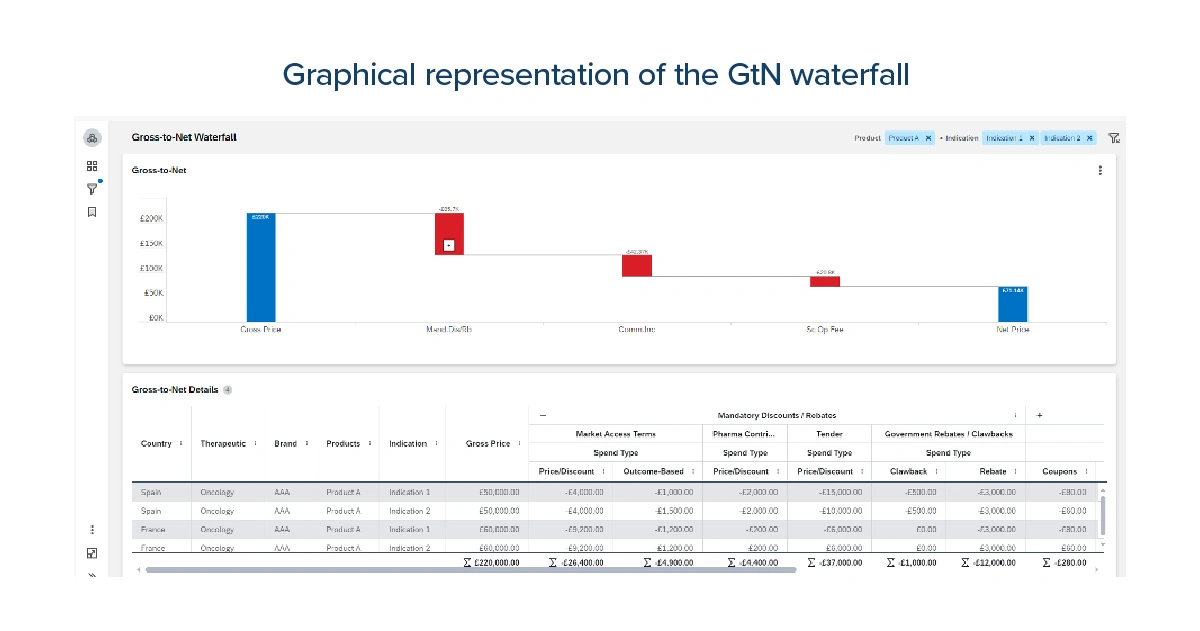
With this approach, you can perform a GtN waterfall analysis by indication, for example, giving you a comprehensive view of the various spending types that affect margins and enabling GtN comparisons. Additionally, this method allows for filtering the why dimension and other attributes such as region, country, margin, therapeutic area, brand, product and indication. This offers a holistic understanding of the factors influencing performance and facilitates analysis of the impact of each spending type on net outcomes for specific products and indications within a region.
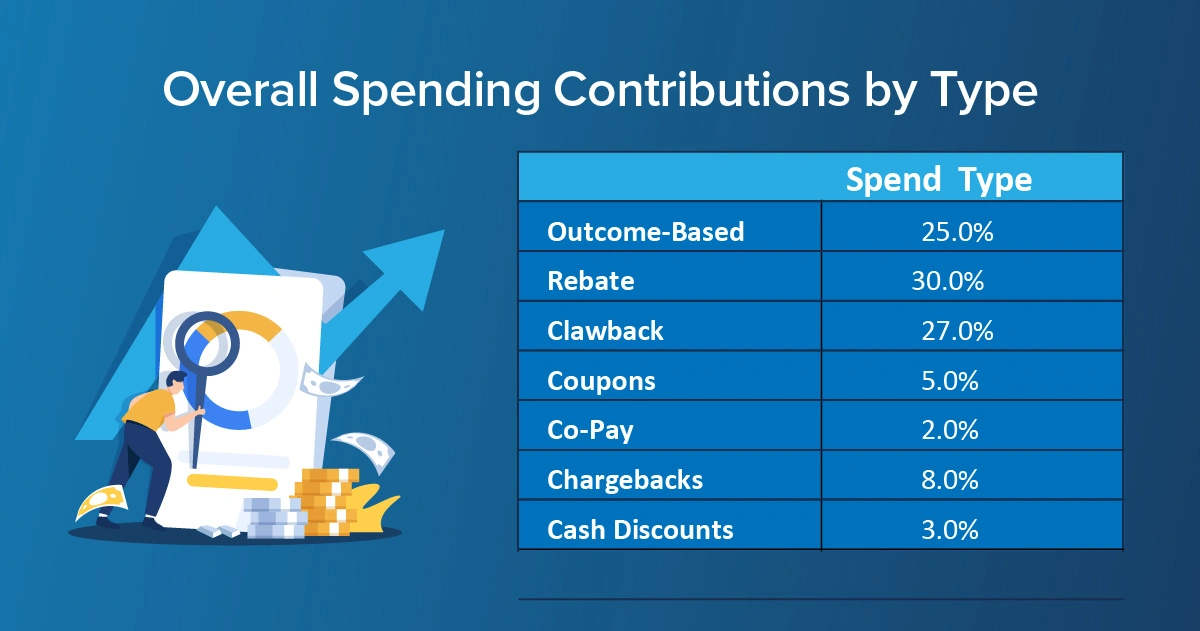
This setup enables various analyses to assess overall spending contributions by type across these selections. For instance, it allows for evaluating the effectiveness of outcome-based contracts across different regions, providing you with the insights needed to make informed strategic decisions.
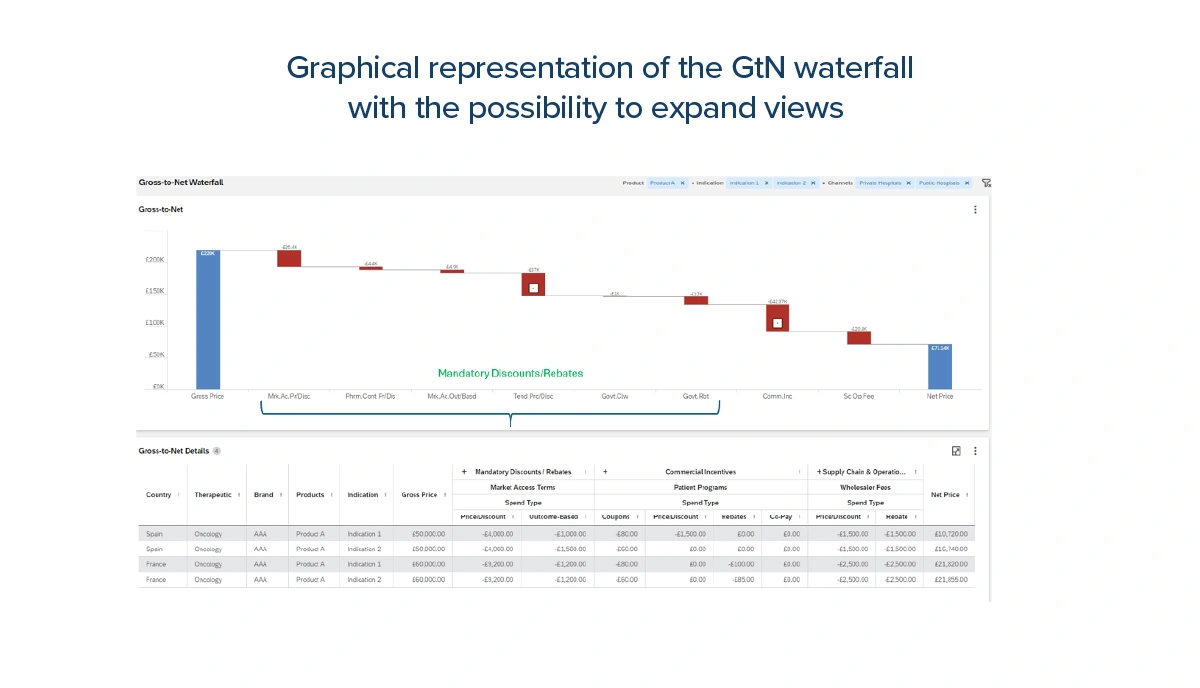
Here are examples of how the graphical representation of the GtN waterfall looks using these multi-lens dimensions:
With the possibility to expand views:
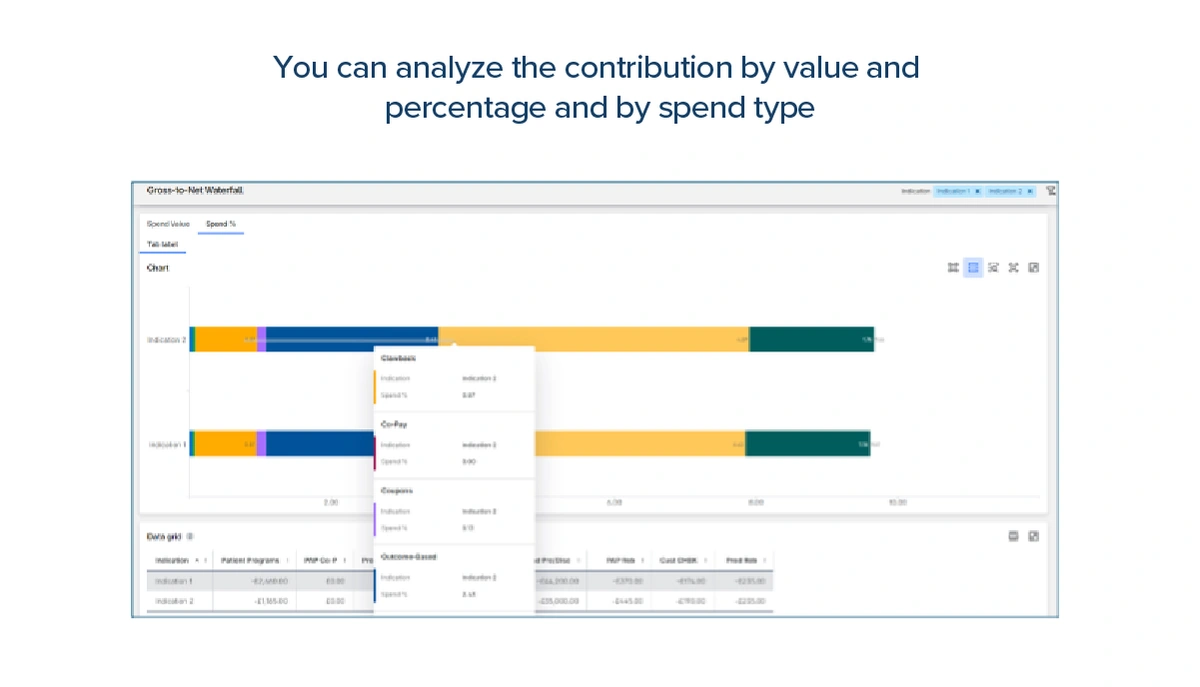
You can analyze the contribution by value and percentage and by spend type:
Rising above the cloudy front
It’s possible to gain full visibility in GtN…and you can accomplish it seamlessly.
Please feel free to contact me if you have any questions or want to learn more about our GtN solutions. You can also watch our webinar, where I discuss Gross-to-Net visibility in more detail and show how this seamless integration is possible.
If you want to understand more about how Gross-to-Net management can work for you:
Gross-to-Net Accruals: manage and accrue for discounts and other financials
Take the Journey
Leveraging an Integrated Gross-to-Net Process for Time Savings, Accuracy and Profitability
Gross To Net: Easy To Say, Not Easy To Do
Get the latest news, updates, and exclusive insights from Vistex delivered straight to your inbox. Don’t miss out—opt in now and be the first to know!


